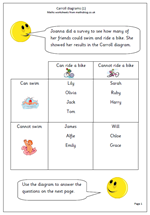
Carroll diagrams are named after the famous writer, Lewis Carroll and are a way of grouping things in a ‘yes or no’ way. They can be as simple as just two boxes but usually they are seen as four boxes with two attributes. In this case the two attributes are swimming and riding a bike and the children either can or can’t do each.
Carroll diagrams are introduced in Year 2 as a means of sorting, but it is not until towards the end of the year, or Year 3 where they would meet these types of diagram. The second page has a set of questions about the diagram and suggests that children then go on to try to collect their own data and make their own Carroll diagram from this data.
Thanks to urbrainy.com for this particular set of pages and they have a great selection of Handling data resources at their site.
