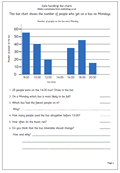
 It is a while since I have posted anything on data handling so here is a page on interpreting bar charts, which also uses the 24 hour clock. it is important to point out that charts such as these must have a proper title and that the axes must be labelled. When children produce their own bar charts they often forget to do this labelling.
When looking at a bar chart one of the first things to do is work out how the numbers are being represented. In this case the number of people on the bus is shown in blocks of 10 and half way between would be a block of 5.