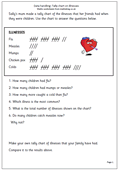
 This worksheet looks at interpreting a tally chart on illnesses which people had when they were children. As well as answering questions which can be worked out mathematically it is important to try and use the data to draw some conclusions. So it is a good idea to discuss the results shown and think whether they show a trend or are they saying anything significant about the world we live in e.g.
If a similar chart had been made in 1900 would the results have been significantly different?
It is also important for children to have a go at collecting data in the form of a tally. A tally is a really good way of showing numbers as it groups them easily into fives, which are easy to count. The usual way of doing a tally is to do four lines down and the fifth across. If, for example, we were to do a tally in tens there would be much more scope for mistakes in the counting of the lines.