 It is not too long now before the latest round of Year 6 SATs comes so I thought I would put a week aside to provide worksheets to help with this.
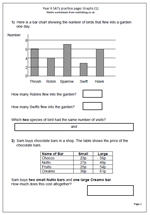
Today I have published a page which looks at the type of question which comes up on interpreting bar charts. A bar chart shows the number of birds that flew into a garden on one day. It is very straightforward, with the numbers on the axis going up in twos.
The second part of the page looks at using a table to find information and the question asks how much two Nutto bars and one Creamo bar would cost. The first step is to find the correct prices and then work out the cost. Two bars at 27p and one at 61p can be added in several ways. For example:
The 27p can be doubled to make 54p and then the 61p added to make 115p or £1.15 or
27p can be added to 61p to make 88p and then add 27p.
The second page is similar, this time looking at a temperature graph and a frequency of throwing dice graph.
These worksheets can be found in the Year 6, Key Stage 2 Maths SAT practice category.