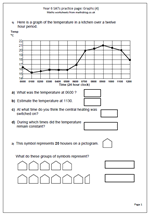
 This worksheet is another in our series on the types of questions that come up on the SAT papers. It is another on graphs, but quite a lot harder. The first part of the worksheet looks at a line graph showing temperatures in a kitchen over a 12 hour period.A key difference between this and other graphs is that every point on the line has a value even between the hours marked.
As well as reading times from the graph it also asks the question, ‘At what time do you think the central heating was switched on?’ This involves interpreting the question and assuming that switching on the central heating would lead to a rise in temperature. Given that it would take a little while for the radiators to warm up it would seem that 0500 would be a good answer. Times either side of this could also be given as correct.
The second part of the worksheet looks at a pictogram, where each symbol represents 20 houses. Again, this is a common type of question that children should have met many times before and should not cause any problems.