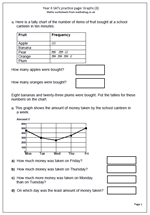
 Here is the next in our mini series of maths worksheets looking at the types of questions involving graphs that come up in the SAT papers. The first part of the worksheet looks at interpreting a tally chart. Children should have had plenty of practice with making and interpreting tally charts from year 2/3 onwards so this should be a very simple question.
The second part of the worksheet is harder, with questions on a line graph. The scale goes up in hundreds and there needs to be a reasonable amount of leeway in the answers given.
This page can be found in the Year 6 maths worksheets category, under Key Stage 2 Maths SAT practice, together with other pages on number, time and shape. Also don’t forget to take a look at Year 6 Maths SAT Papers where you will find lots more questions taken from recent test papers plus ways to approach them.