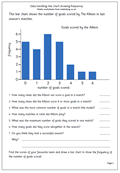
 This bar chart is of a type which children may not have come across before. It shows the frequency of events; in this case the frequency of the number of goals scored by ‘The Albion’. The term ‘mode’ is used, which means the most common as well as other terms such as ‘maximum’.
Care needs to be taken when answering questions such as how many goals did they score in total? It is no good just reading the frequency from the left hand side – look at the number of times two goals were scored, which is 6 times. This means that 12 goals were scored in these games!
Old football tables can be easily found in papers etc and prove a rich source of data for children to create their own frequency charts.