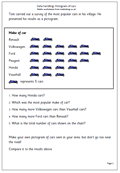
 Graphs are often perceived as a quite easy part of maths, but many children find interpreting them correctly quite tricky. This page looks at the most popular cars seen in a village. Each picture of a car represents 5 cars. Again this page should be seen more as a starter to go and collect data themselves and make their own pictograms. problems might arise when the data is not in whole fives or tens. This can be solved by showing part of a car eg a wheel could represent one car. This would need to be shown clearly on the pictogram.