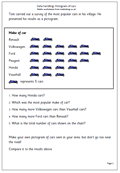
 Graphs are often perceived as a quite easy part of maths, but many children find interpreting them correctly quite tricky. This page looks at the most popular cars seen in a village. Each picture of a car represents 5 cars. Again this page should be seen more as a starter to go and collect data themselves and make their own pictograms. problems might arise when the data is not in whole fives or tens. This can be solved by showing part of a car eg a wheel could represent one car. This would need to be shown clearly on the pictogram.
Category: Free Year 4 Maths Worksheets
Data handling for year 4: pictogram of birds
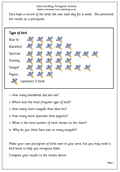 Here we have another in our series of data handling worksheets for year 4. Each bird on the pictogram represents 5 birds. This page is a starter to show children how to complete and interpret a pictogram so that they can go on to create their own. In this case more information about the most common birds in the garden can easily be found on the internet and a hypothesis can be made as to whether a local survey would give similar results.
Data handling for Year 4: tally charts (2)
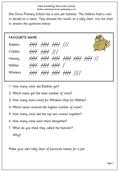 Here is another in our series of maths worksheets on data handling, most suited to year 4 children. The ability to count up in fives is important for using tally charts effectively and whilst the majority of the page is to do with interpreting results from a chart, probably it is more important that children have a go at making their own tally charts and drawing some conclusions from them.
Favourite pets/foods/colours/games etc are all good subjects for a survey; it is also a good idea to make a hypothesis at the beginning eg ‘I think blue is boys’ favourite colour’…
Maths Worksheet: Count on Whole Hundreds
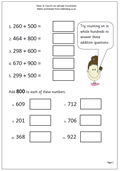 This worksheet is very similar to the year 4 ‘count on in tens’, but this time it is counting on in whole hundreds. When working these out the tens and units can be ignored as they do not change – just add up the hundreds and write them down with the tens and units.
Most of these questions cross the thousands boundary and provide good practice at reading larger numbers.
Data handling for Year 4: Tally charts (1)
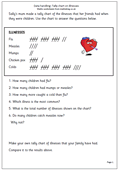 This worksheet looks at interpreting a tally chart on illnesses which people had when they were children. As well as answering questions which can be worked out mathematically it is important to try and use the data to draw some conclusions. So it is a good idea to discuss the results shown and think whether they show a trend or are they saying anything significant about the world we live in e.g.
If a similar chart had been made in 1900 would the results have been significantly different?
It is also important for children to have a go at collecting data in the form of a tally. A tally is a really good way of showing numbers as it groups them easily into fives, which are easy to count. The usual way of doing a tally is to do four lines down and the fifth across. If, for example, we were to do a tally in tens there would be much more scope for mistakes in the counting of the lines.
Mental Arithmetic: Subtracting 19 from 2-digit numbers
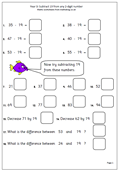 This is very similar to the process of adding 19 to a 2-digit number. The easiest way to do this is usually to take twenty and then add one. This mental arithmetic method is much quicker than carrying out the question using pencil and paper methods.If children can grasp these ideas it gives them a great deal of confidence and they can develop their own mental methods of answering other, similar questions; eg subtract 18 by taking 20 and then adding 2, or subtracting 39 by taking forty and adding one.
Mental Arithmetic: Add 29, 39, 49 to any 2-digit number
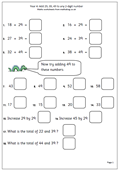 Here we continue with our mental arithmetic series on addition by looking at adding 29, 39 and 49 to 2-digit numbers. Make sure that your child is confident with adding 9 before going on to these. Once again the process is the same: add the nearest whole ten and then subtract 1. Once this has been mastered similar techniques can be used to add 2-digit numbers that have 8 in the units, subtracting two rather than one, which makes adding any 2-digit numbers fairly straightforward!
This page, and many others, can be found in our Year 4 maths worksheets under Knowing Number Facts.
Maths Worksheet: Add 19 to any 2-digit Number
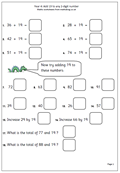 By year 4 children should be comfortable with 2-digit addition ‘in their heads’. This maths worksheet on adding 19 to any 2-digit number will show whether they are confident and quick with their mental methods.
There are usually two processes involved when adding 19. It is often best done by adding twenty and subtracting one, although some children may well add ten and then add 9. This is easier and quicker than writing the sum down in columns and adding up using the standard method.
Maths Worksheet: Year 4 Count on Whole Tens
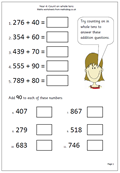 This worksheet looks at counting on in whole tens from 3-digit numbers, probably most suited for Year 4 children. There are a number of different strategies that children use to do this type of question. Some will count on in tens (still using fingers to record the number of tens they have counted). Others will use more efficient methods, such as, adding the tens digits and then adjusting the hundreds.
Data handling for year 4: Bar charts
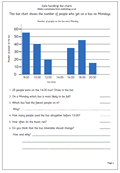 It is a while since I have posted anything on data handling so here is a page on interpreting bar charts, which also uses the 24 hour clock. it is important to point out that charts such as these must have a proper title and that the axes must be labelled. When children produce their own bar charts they often forget to do this labelling.
When looking at a bar chart one of the first things to do is work out how the numbers are being represented. In this case the number of people on the bus is shown in blocks of 10 and half way between would be a block of 5.