Resource of the Week: probability as a fraction

Probability does cause some confusion with children, partly because it can be expressed in several ways and because it is very hard to find events which are absolutely certain to happen, or not happen.

One way of displaying the probability of an event is as a percentage: for example, there is a 50% chance of landing on a head when tossing a coin.

Another way is as a fraction: there is 1/2 chance, or one in two chance of landing on heads.

A third way is as a decimal fraction, where zero means no chance and 1 is certain: there is 0.5 chance of landing on heads. Probability can be displayed along a number line marked from zero to one.

A the end of the page there is a tricky probability line where the events have to be placed in order of likelihood.

This year 6 maths worksheet is the second published which looks at probability as a fraction and then as a decimal fraction. A calculator would be useful to do the conversion and it is suggested that the answer should be displayed to 2 decimal places. A useful homework sheet.
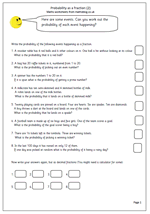
Giving the probability as a fraction_(pg 2)

Key Stage 2 Maths SAT practice: graphs (4)

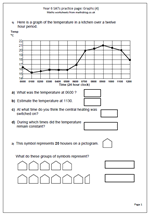
This worksheet is another in our series on the types of questions that come up on the SAT papers. It is another on graphs, but quite a lot harder. The first part of the worksheet looks at a line graph showing temperatures in a kitchen over a 12 hour period.A key difference between this and other graphs is that every point on the line has a value even between the hours marked.

As well as reading times from the graph it also asks the question, ‘At what time do you think the central heating was switched on?’ This involves interpreting the question and assuming that switching on the central heating would lead to a rise in temperature. Given that it would take a little while for the radiators to warm up it would seem that 0500  would be a good answer. Times either side of this could also be given as correct.

The second part of the worksheet looks at a pictogram, where each symbol represents 20 houses. Again, this is a common type of question that children should have met many times before and should not cause any problems.

Graphs (4)

Year 6 SATs practice: graphs (3)

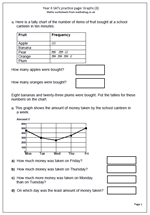
Here is the next in our mini series of maths worksheets looking at the types of questions involving graphs that come up in the SAT papers. The first part of the worksheet looks at interpreting a tally chart. Children should have had plenty of practice with making and interpreting tally charts from year 2/3 onwards so this should be a very simple  question.

The second part of the worksheet is harder, with questions on a line graph. The scale goes up in hundreds and there needs to be a reasonable amount of leeway in the answers given.

This page can be found in the Year 6 maths worksheets category, under Key Stage 2 Maths SAT practice, together with other pages on number, time and shape. Also don’t forget to take a look at Year 6 Maths SAT Papers where you will find lots more questions taken from recent test papers plus ways to approach them.

Graphs (3)

Year 6 SATs practice: Graphs (1 and 2)

It is not too long now before the latest round of Year 6 SATs comes so I thought I would put a week aside to provide worksheets to help with this.

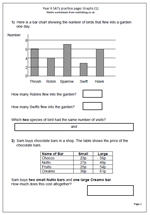
Today I have published a page which looks at the type of question which comes up on interpreting bar charts. A bar chart shows the number of birds that flew into a garden on one day. It is very straightforward, with the numbers on the axis going up in twos.

The second part of the page looks at using a table to find information and the question asks how much two Nutto bars and one Creamo bar would cost. The first step is to find the correct prices and then work out the cost. Two bars at 27p and one at 61p can be added in several ways. For example:

The 27p can be doubled to make 54p and then the 61p added to make 115p or £1.15 or

27p can be added to 61p to make 88p and then add 27p.

The second page is similar, this time looking at a temperature graph and a frequency of throwing dice graph.

These worksheets can be found in the Year 6, Key Stage 2 Maths SAT practice category.

Graphs (1)

Graphs (2)


More on equivalent fractions

Equivalent fractions are fractions which look different but have the same value. The easiest example of equivalent fractions is a half and two quarters. If I have half of a fruit cake that is the same as having two quarters of the same cake. (As long as I pick up all the crumbs from cutting it!)

Not all equivalent fractions are that easy to work out, but as a rule it can be said that:

If we multiply the top and bottom numbers in a fraction by the same value we will get an equivalent fraction.

The same can be said of division:

If we divide the top and bottom numbers of a fraction by the same value we will get an equivalent fraction.

Dividing is really useful as it ‘simplifies’ the fraction, often making it easier to read or to picture. For example 10/100 is equivalent to 1/10 as both top and bottom have been divided by 10.

Now, the fraction will only get simpler if we can successfully divide both top and bottom numbers without leaving a remainder! This is the key, and, as so often, a good knowledge of tables helps here.

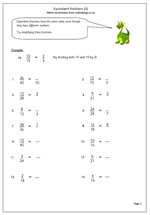
This worksheet looks at simplifying fractions. As shown above, this is done by dividing the top and bottom of the fraction by the same number. This division process might need to be done more than once. For example: 8/12 can be simplified to 4/6. This in turn can be simplified to 2/3.

Equivalent fractions (pg 3)

Resource of the week: reflective symetry

Reflective symmetry seems to be a very popular topic for the Key Stage 2 Maths SAT Papers and it is not easy to find examples of the kind of question which is often asked. There are several mathematical terms to do with symmetry that children need to be familiar with. These include:

Mirror line,  line of symmetry,  line symmetry,  symmetrical,  reflect,  reflection,  translation, axis of symmetry, reflective symmetry.

Also they should be able to test for symmetry using a mirror and by folding.

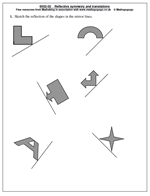
Children should be able to sketch the reflection of a simple shape in a mirror line where none or only some of the edges of the shape are parallel or perpendicular to the mirror line.

This might seem easy, but actuallyoften proves to be problematic to many children. A small mirror is a great help with this and children are supplied with one in their SAT tests if such a question comes up.

Here we have the second of a pair of worksheets which looks at sketching the reflection of shapes in the mirror lines.

Year 6 maths worksheet: Reflective symmetry

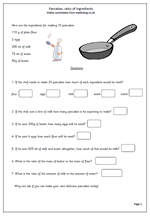
Pancake day: maths worksheet on ratio

Pancake Day is usually known as Shrove Tuesday and it the last day before the period known as Lent in the Christian calendar. The idea is that Shrove Tuesday is the last chance to use up foods that you are not allowed during Lent, a time of abstinence and giving things up.
Pancakes  are eaten on this day because they contain butter, eggs and fat which are not allowed during Lent.
This maths worksheets takes a look at the ingredients needed to make pancakes and then asks some pretty tricky questions involving ratio, so it is probably best suited to Year 6 children.
It is not easy to find ratio worksheets, but recipes are an ideal subject.
Thanks to urbrainy.com for letting me use this page from their site and they have many more great maths worksheets on special occasions as well as thousands of other maths worksheets.

This page can be found in the year 6 Understanding Number category.

Pancake Day: ratio


Maths SAT Paper 2011 Paper B Questions 8 and 9

Here are two more questions from the Maths SAT Paper 2011 Paper B.

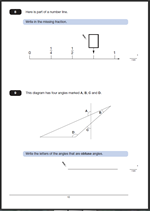
The answer to Question 8.   3/4
One mark awarded for a correct answer.
Equivalent fractions accepted as is 0.75.
Suggested method:
This question is another reading a number line problem and if children can count in quarters it is an easy mark. Firstly, it has to be recognised that the number line is showing quarters (1/2 is equivalent to 2/4 and 1 is equivalent to 4/4) making the missing number 3/4.

The answer to Question 9. A and D.
One mark awarded for a correct answer.
The letters can be given in either order. Both need to be given with no incorrect angles added.
Suggested method:
Answering this question correctly depends on 3 things:
Firstly, a recognition of the conventions for labelling angles, using the arc.
Secondly, a knowledge that an obtuse angle is larger than 90? but less than 180?.
If either of these are unknown it becomes purely a guessing game. (Some children do think that the angle depends on the length of the lines rather than a measure of turn.)

Thirdly, if these are known, then the obtuse angles still need to be recognised. One way to do this is to slide a right angle (eg a corner of a piece of paper) into the angle to see whether it is smaller or larger.

Why not visit ks2-maths-sats.co.uk for free SATs papers and a great SAT revision programme?

Questions 8 and 9 from SAT Paper B 2011

Questions 8 and 9 answers and suggested method 2011 Paper B

KS2 Maths SAT Paper B 2011: Question 7

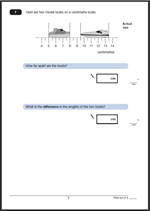
Here are the answers and tips on how to go about answering question 7 from the KS2 Maths SAT Paper B 2011. Two small boats are positioned along a centimetre scale and two questions follow.

The answer to question 7a:   1 ½ or 1.5
One mark awarded for a correct answer.
Suggested method:
This question is all about reading scales. The first thing to work out is how the scale has been labelled, which is every centimetre, with every half centimetre marked but not labelled. To work out the distance between the two boats read the scale at the end of boat 1, which is 8 cm and the scale at the start of boat 2, which is 9.5 cm. Subtract to find the difference.
Alternatively, count the number of half centimetre units between the boats, which is 3.
3 half centimetres is 1.5 cm.

The answer to question 7b: 1
One mark awarded for a correct answer.
Suggested method:
Find the length of boat 1, which is 3 cm.
Find the length of boat 2, which is 4 cm.
Subtract 3 cm from 4 cm to leave 1 cm.
Unusually for this type of question it is drawn to actual size so a ruler could be used.
Please note that a pdf printout may not be exactly the size of the original page, depending on printer settings.

Question 7

Question 7 answers and suggested method 2011 paper B

KS2 Maths SAT Paper B question 6

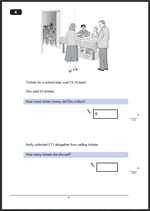
Question 6 of the KS2 maths SAT Paper B is in two parts and it would be most sensible to use a calculator.

The first part of the question looks at the cost of 23 tickets at £2.75 each.

The answer to question 6a is  £63.25
One mark awarded for a correct answer.
Any unambiguous indication of the correct amount is acceptable, including: £63.25p, £63.25 pence or £63,25.

Suggested method:

This question is mainly a matter of deciding what process to carry out and using a calculator accurately.
Some children have very little practice with a calculator and may be tempted not to use it.
Recognising that this is a multiplication question and carefully keying in the correct amount, including the decimal point should ensure a correct answer is reached.
Remind children it is always worth carrying out a reverse operation to check that the answer is correct. In this case £63.25 divided by 23 will give £2.75.

The second part gives the total amount from ticket sales and asks how many tickets were sold.

The answer to question 6b is 28.
One mark awarded for a correct answer.

Suggested method:

Easy one mark use a calculator to divide £77 by 2.75. Perhaps the one major error that children can make is to put the numbers in the wrong way round on the calculator (2.77 ÷ 77).

Why not visit ks2-maths-sats.co.uk for free SATs papers and a great SAT revision programme?

Question 6

Question 6 answers and suggested method 2011 paper B