News: 09 09 09 09 09 09: another amazing date

You all know how I like interesting dates and we are rapidly moving towards another fascinating date.

On the 9th second of the 9th minute of the ninth hour of the ninth day of the ninth month of the ninth year the date will be:

09 09 09 09 09 09 .

To you and me that’s the 9th of September 2009.

If you are teaching these kinds of dates can lead to some fascinating maths investigations – how long before the next time this happens? What similar dates are likely to come up soon? etc.
Data handling for Year 4: Tally charts (1)

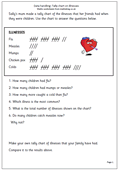
tally-chart-fluThis worksheet looks at interpreting a tally chart on illnesses which people had when they were children. As well as answering questions which can be worked out mathematically it is important to try and use the data to draw some conclusions. So it is a good idea to discuss the results shown and think whether they show a trend or are they saying anything significant about the world we live in e.g.

If a similar chart had been made in 1900 would the results have been significantly different?

It is also important for children to have a go at collecting data in the form of a tally. A tally is a really good way of showing numbers as it groups them easily into fives, which are easy to count. The usual way of doing a tally is to do four lines down and the fifth across. If, for example, we were to do a tally in tens there would be much more scope for mistakes in the counting of the lines.

Tally chart – flu

Resource of the Week: Learning Times Tables

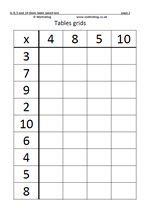
zz48510-table-1Making the effort to learn times tables or multiplication tables is one of those things which keep coming back as being crucial for success with maths. Certainly having a rapid knowledge of tables is an enormous help and they should be learnt as sentences eg ‘4 times 6 is 24’, ‘5 times 6 is 30’ etc and not just ‘6, 12, 18, 24, 30’ etc.

I still remember rote learning times tables as a child and there is really no other way of doing it.

There are a number of pages on the site which test knowledge of tables to be found in our four rules section, under multiplication.

Learning tables worksheets

Data handling for year 5: bar chart showing frequency

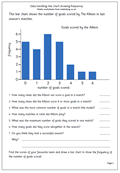
bar-chart-footballThis bar chart is of a type which children may not have come across before. It shows the frequency of events; in this case the frequency of the number of goals scored by ‘The Albion’. The term ‘mode’ is used, which means the most common as well as other terms such as ‘maximum’.

Care needs to be taken when answering questions such as how many goals did they score in total? It is no good just reading the frequency from the left hand side – look at the number of times two goals were scored, which is 6 times. This means that 12 goals were scored in these games!

Old football tables can be easily found in papers etc and prove a rich source of data for children to create their own frequency charts.

Bar chart showing frequency: football