Resource of the week: sorting shapes in Year 1

One of the earliest stages of data handling is to be able to sort and a lot of practical work can be done, such as tidying up a drawer of pens, pencils, paper clips etc. Don’t underestimate this type of practical activity as it is important for children learning to group and order objects.

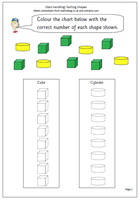
The next stage is to be able to record the results and here we have a simple page where the two sets of shapes can be sorted and recorded on the columns.

The outlines of the cylinders and cubes are provided and it is just a matter of counting the number of each shape and recording by colouring the correct number on the columns.

The task can be extended by providing real cubes, keeping to two or three colours and recording how many there are in columns.

This page can be found in our Handling Data section for Year 1.
Sorting shapes 1

Year 1 maths worksheet: subtraction

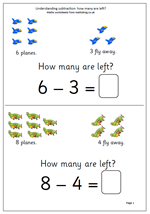
It has been a while since I published anything for year 1, so here are a couple of pages on understanding subtraction. They look very straightforward but there are a number of concepts involved here:

Firstly, understanding that the phrase, ‘How many are left’ .

Secondly, relating subtraction to ‘taking away’.

Thirdly, the answer can be found by counting up from a number.

Fourthly, the answer can be found by counting back from the larger number.

Finally, that the minus sign means subtract.

Thanks to urbrainy.com for letting me use these two pages.

How many are left?


Resource of the Week: Easter co-ordinates for Year 4

As we move towards Easter it is always fun to have some maths linked to the time of year.

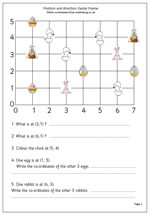
There are several important aspects to this page. Firstly the axes are numbered rather than the spaces. This is an important step as the conventions of using co-ordinates come into play. It is important to show how co-ordinates are written:

e.g. (3, 1)

Brackets are always placed around the co-ordinates, with the numbers separated by a comma. The position (3, 1) means 3 along and 1 up, which in this case takes you to the pink rabbit (and not the rabbit holding the basket of eggs).

The grid can be used for further work: e.g.

1.ask how you can move along the lines to go from one point to another (2 along and 1 up)

2. Draw more features at the points and ask where they are positioned.

3. Ask child to draw an egg at a certain point etc.

This can be found in the Year 4 Shape category.

Thanks to urbrainy.com for allowing me to use it.

Easter coordinates

Year 3 graphs

There are two main aspects to graphical work, one is to collect and organise data and the other is to interpret the results whether shown as a graph, pictogram etc.

This page looks at interpreting a bar chart showing the number of packets of crisps sold by a corner shop over the course of a week. One of the main concepts here is that the vertical axis is labelled in twos rather than just going up in ones. This means that children must be able to read from unlabelled axes for the first time.

There are plenty of simple calculations here with questions such as, ‘How many more packets of crisps were sold on Sunday than on Friday?’ but there are also questions to make children think a little more carefully about what the bar chart is showing. These are more open ended, with no one correct answer and are good starting points for discussion.

Bar charts


Resource of the Week: interpret pie charts

Something which looksvery easy, but can cause difficulties for this week’s Resource of the Week. Pie charts are a good way to illustrate the proportion of a whole amount or quantity. The arc length of each sector or the sectors area is proportional to the quantity it represents. This might sound a little tricky, but pie charts can be effective in displaying information.

This worksheet looks at a pie chart where the percentages have also been given. This allows for numbers to be worked out if the total number is given. The first pie chart looks at ice cream sales and the second looks at football supporters attending a tournament.

Pie chart (1)

Understanding factors

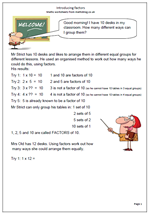
Understanding factors can prove to be quite tricky, but in fact is a fairly simple concept, with once again knowing times tables being crucial. These pages begin by trying to find the factors of a number on an organised ‘trial and error’ basis by seeing which numbers when multiplied together will make the target number.

When doing this it saves time if it is understood when to stop.

For example; the factors of 10:

Try 1:  1 x 10 =  10        1 and 10 are factors of 10
Try 2:  2 x  5  =  10        2 and 5 are factors of 10
Try 3:  3 x ??  =  10       3 is not a factor of 10 (so he cannot have 10 tables in 3 equal groups)
Try 4:  4 x ??  =  10       4 is not a factor of 10 (so he cannot have 10 tables in 4 equal groups)
Try 5:  5 is already known to be a factor of 10 2 x 5 is the same as 5 x 2. There is no need to go further than this.

Introducing factors

Resource of the Week: half way between

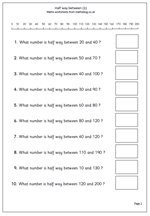
Today I’m looking at a resource which has proved to be very popular and on the face of it this looks quite a simple task. However, many children (and adults) find it very tricky to work out what half way between two numbers is. Often there is a lot of ‘trial and improvement’ going on in people’s heads as they guess their way towards finding half way.

Two methods make the task fairly straightforward.

For method one a number line is very useful to start with. Put a finger of the left hand on the first (lower) number shown on the number line and a finger of the right hand on the second number. Then move the left hand finger one place to the right and the right hand finger one place to the left. Repeat this until the two fingers meet – that is your half way number.

The second way of finding half way involves two steps:

step 1: add the two numbers.

step 2: halve the answer.

This is the better method as it works for all numbers, not just those shown on the number line.

This page can be found in our Year 3, Counting and Number section

Half way between_(1)

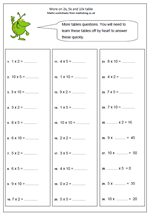
More 2x, 5x and 10x tables

Children need an awful lot of practice when learning the 2x, 5x and 10x tables and don’t be afraid to encourage them to say these tables out loud and learn them by rote. You will probably find that they can recite the lyrics of a latest pop song, or all eleven of their favourite football team’s line up so there is little or no reason why they can’t learn tables – motivation is probably the main factor.

This page will show immediately whether these tables have been learned. It can be answered very quickly – just a couple of minutes, or it may take some time. Anything over 3 or 4 minutes will show that the times tables have not been learned off by heart.

This page can be found in the Four Rules category.

More 2x, 5x, 10x practice